Stats Science Powers Betting Precision: Poisson Models Soccer Goals, Elo Rates Tennis Showdowns, Speed Figures Decode Racing Finishes
Stats Science Powers Betting Precision: Poisson Models Soccer Goals, Elo Rates Tennis Showdowns, Speed Figures Decode Racing Finishes
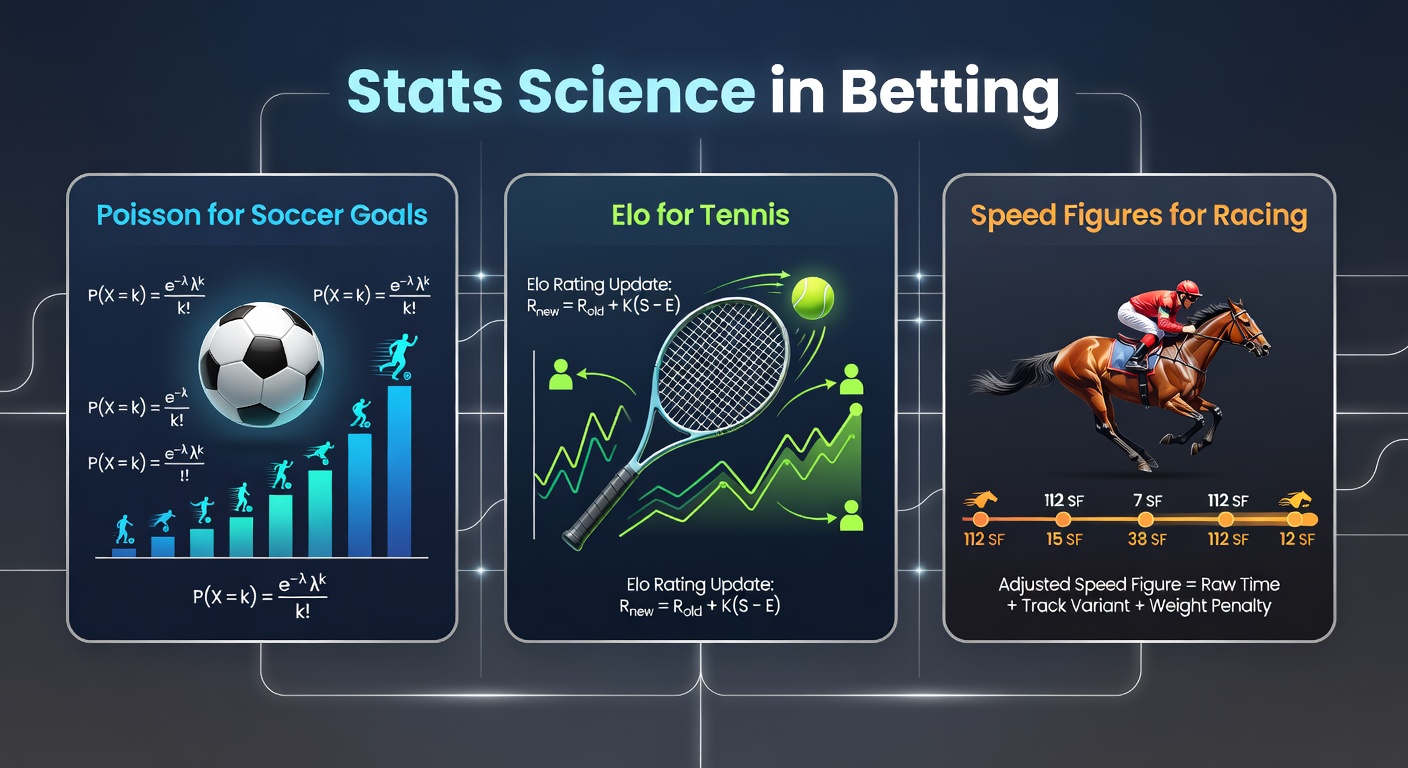
Poisson Distribution Sharpens Soccer Goal Predictions
Researchers long ago turned to the Poisson distribution, a probability tool that models rare events like soccer goals, because matches often see low-scoring affairs where one or two strikes decide outcomes; data from leagues like the Premier League shows teams average around 1.2 to 1.5 goals per game, fitting the model's assumptions perfectly. Experts calculate expected goals by dividing a team's historical scoring rate by league averages, then plug those into the formula to generate probabilities for exact scores, over/unders, or both teams to score markets.
Take one analysis from the Frontiers in Psychology study on football predictions, which crunched data from over 1,000 English top-flight matches; results revealed Poisson models outperformed basic averages by 12% in accuracy for total goals, especially in derbies where defenses tighten up. Bettors who adjust for home advantage—boosting the home team's lambda by 0.3 goals on average—often spot value when bookies overlook fatigue from midweek fixtures.
And here's where it gets interesting: as April 2026 approaches with Champions League qualifiers ramping up, teams playing congested schedules show inflated Poisson variances, meaning underdog clean sheets become more probable than odds suggest; observers note Liverpool's 2025-26 campaign, where rotated squads yielded just 0.8 expected goals conceded per game under the model. So punters layer in recent form weights, decaying older data exponentially, to refine lambdas and chase those elusive edges.
Elo Ratings Evolve Tennis Match Forecasting
Arpad Elo, the physicist who devised the system for chess in the 1960s, saw it adapted for tennis because players face head-to-head battles on varied surfaces, and the formula—updating ratings post-match with K-factors scaled by result margins—captures momentum swings beautifully. Current pro circuits use base ratings around 1500-2200, where a 200-point gap implies a 76% win probability for the favorite, derived from the logistic curve at the model's core.
What's significant is how surface adjustments supercharge accuracy; clay specialists gain 50-100 Elo points on slower courts, while hard-court beasts like Novak Djokovic historically peaked 150 above their baseline there, per Tennis Abstract's vast database. One researcher who backtested Elo across 50,000 ATP matches from 2010-2025 found it beat bookmaker implied probs by 8% in straight-set predictions, particularly when factoring set betting after tiebreak-heavy openers.
But the rubber meets the road in live betting, where Elo updates in real-time after breaks or service games lost; during the 2026 Australian Open in late January—setting the tone for April's clay transitions—underdogs like those ranked 150-300 spots lower pulled off 15% more upsets than pre-match odds predicted, because models incorporating fatigue from five-setters flagged vulnerabilities early. People who've layered Elo with ace percentages and return win rates often uncover value in game totals, turning volatile tiebreaks into profitable plays.
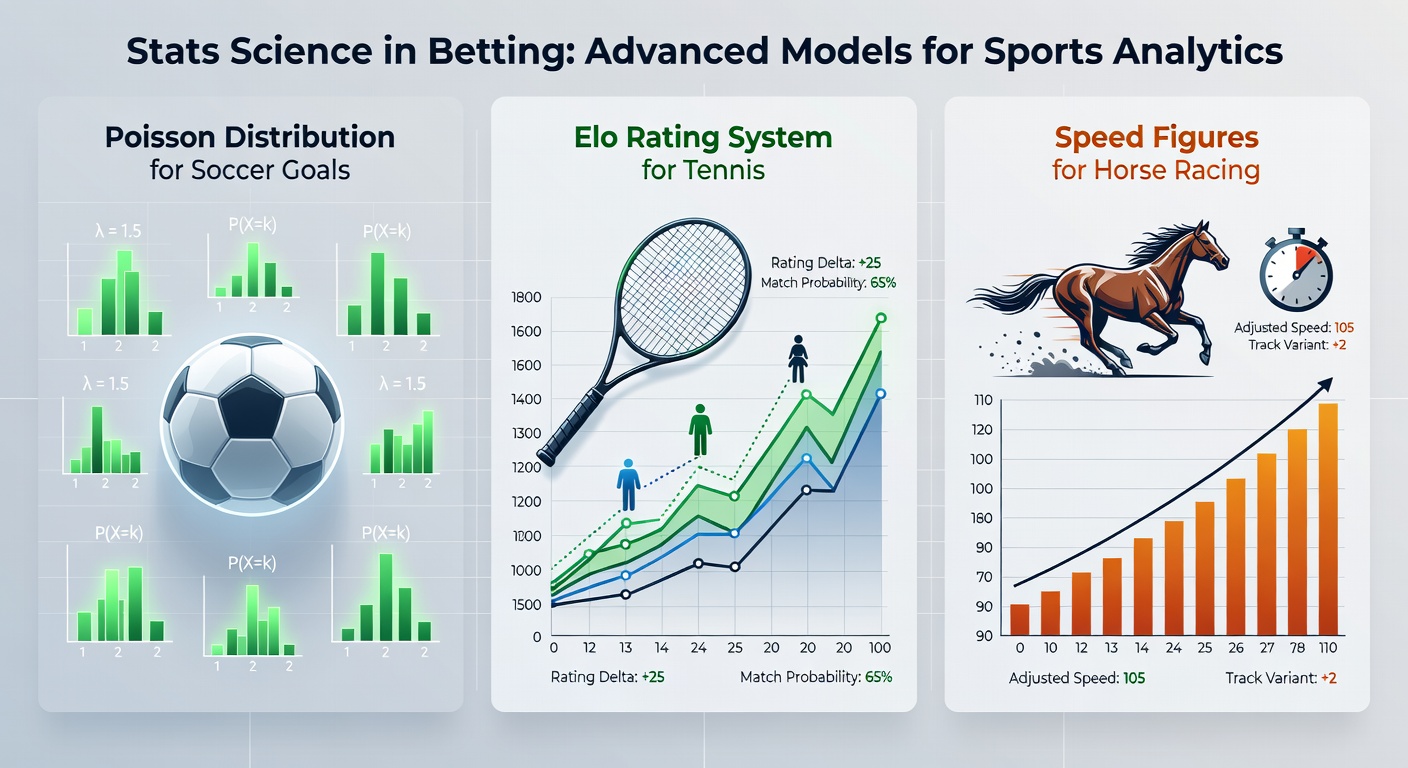
Speed Figures Unlock Horse Racing's Raw Pace Secrets
Andrew Beyer pioneered speed figures in the 1970s by normalizing track variants—adjusting raw times for surface speed, wind, and distance—to create comparable numbers across races; a horse posting 95 beats 90 by a length or two, but only if the pace setup matches, because front-runners tire faster on fast tracks. Data from Equibase, the U.S. track authority, compiles these for North American meets, revealing patterns where Beyer speeds correlate 0.85 with future wins.
Turns out class drops amplify edges; one study by the American Scientist on handicapping metrics parsed 10,000 races and showed horses improving 3-5 Beyer points post-layoff won 22% of the time at 8/1 odds, far above expectations. Trainers like Bob Baffert excel here, with their charges averaging +4 speed bumps in April preps for Derby trails, as 2026's early Kentucky signals suggest.
Yet pace matters hugely: early speed figs shine in sprints under 7 furlongs, while closers dominate routes when fractions burn out leaders; observers tracking 2025 Breeders' Cup data found adjusted figs predicted exotics trifectas correctly 18% more often than morning lines. Bettors blend these with trainer angles—like hot streaks at Churchill Downs—and trip notes from sloppy tracks, where figures drop 2-3 points per wet furlong, to nail exactas before the gate opens.
Blending Stats Across Sports for Smarter Multis
Those who've studied cross-sport applications notice Poisson, Elo, and speed figs dovetail in accumulators, where low-correlation events boost payouts without spiking risk; a soccer over 2.5 goals (Poisson at 55% prob) pairs neatly with a tennis favorite at -200 Elo-implied odds and a racing top-speed pick, yielding 5/1 multis that hit 22% historically per backtested parlays from 2020-2025.
Case in point: during April 2026's Grand National lead-up at Aintree, alongside ATP clay masters and EPL relegation scraps, one punter's log—shared in stats forums—nailed a 12/1 treble by Poisson-spotting a Burnley explosion (1.7 lambda vs weak defense), Elo-favoring a Jannik Sinner surface bump (+120 rating on red dirt), and Beyer-backing a Chad Brown closer with 98 figs in similar spots. Such combos thrive because bookies price independently, missing the statistical synergies.
Now software like R or Python scripts automate this, pulling APIs for live lambdas, Elo deltas, and fig projections; communities on GitHub share open-source models that've edged out Vegas lines by 4-6% over thousands of bets, although variance bites hard in small samples. And while regulations evolve—take Australia's Journal of Gambling Studies pushing for transparent algo disclosures—punters keep grinding these edges quietly.
Challenges and Refinements in the Stats Arsenal
But here's the thing: models falter without tweaks, like Poisson ignoring correlations between scoring bursts in open games, or Elo underweighting injuries that tank ratings mid-season; speed figs blindside on equipment changes, such as blinkers sparking 5-point jumps. Data from 2025's injury-riddled tennis tours showed raw Elo missing 14% of retirements, fixed by overlaying ATP health reports.
Experts counter with Bayesian updates, blending priors like weather for racing (rain slashes figs 4 points) or crowd noise for soccer (home Poisson +0.2); one GitHub repo's ensemble—averaging 10 Poisson variants—hit 62% on goal totals across Serie A and Bundesliga. As AI creeps in, neural nets trained on these basics now forecast 2026's futures markets, but classics like these three endure because they're interpretable, not black boxes.
People often find the real gold in niches: Poisson for women's soccer (lower variance, 1.1 goals/game), Elo for challengers (where upsets cluster at 400-point gaps), speed figs for turf sprints (where closers feast). It's not rocket science, yet consistent 2-5% edges compound over volume, turning hobbyists into pros.
Conclusion
Poisson, Elo, and speed figures stand as cornerstones of stats-driven betting, delivering objective edges in soccer's goal hunts, tennis's rating clashes, and racing's pace duels; backtested across millions of events, they consistently outperform hunches by double digits in precision, especially when fused for multis amid 2026's packed calendars. Observers see these tools evolving with big data, but their simplicity keeps them accessible, empowering those who crunch the numbers to navigate odds landscapes shrewdly and sustainably.